[EN] Turning influenza surveillance into hospital action: between test positivity and patient demand | 2026-11-14
관리자
SCH Disaster Medicine Center — Analysis
2026-11-14 · SCH-COLUMN-2026-11-14 · FLU-DENOMINATORS · EN
When the numbers rise, first ask what is being counted
The decisions a hospital must make when influenza activity rises are concrete: how to organize waiting areas, who will transport specimens, and who will acknowledge results released overnight. A rise in test positivity does not, by itself, tell the hospital how many beds or ambulances it needs. People who are tested, people attending outpatient services, and people waiting in an emergency department for admission are different populations. Starting with recent developments in Korea and abroad, this column examines the steps between surveillance information and operational decisions. The central question is not whether to acknowledge influenza circulation, but which decisions each measure can reasonably support.
In Korea, the Korea Disease Control and Prevention Agency (KDCA) stated on 11 November that the national immunization programme was proceeding normally, responding to reporting about difficulties some organizations faced in purchasing influenza vaccines. This was the agency's account of supply conditions, not a facility-by-facility confirmation that any desired vaccine would always be available.[1] Within the material checked for this column, we did not identify a separate official report of a new domestic disaster or major health emergency occurring today, 14 November. The Korean item is therefore presented as follow-up context to an announcement made three days earlier. Vaccine supply and current emergency department demand are also different questions; neither should stand in for the other.
The US Centers for Disease Control and Prevention (CDC) reported increasing influenza activity in its 13 November release. The reporting period was week 44 of 2026, ending on 7 November.[2] These were neither cases occurring only on the publication date nor a real-time account of conditions on 14 November. Collection, processing and publication take time. Rising activity in the United States can prompt Korean institutions to review readiness, but cannot alone predict the size or timing of Korea's influenza peak. In particular, a national signal from another country is an insufficient basis for estimating the next shift's demand at a local emergency department.
The UK Health Security Agency's (UKHSA) week 46 report, published on 12 November, includes the situation during week 45, from 2 to 8 November. It describes influenza activity in England as increasing while remaining at a low level under the surveillance system's classification.[3] Placing its week number beside the US week number without checking the dates can make different observation periods look simultaneous. “Low” is also a classification under defined surveillance criteria. It is not an operational assurance that a particular hospital has spare capacity. This is why national or regional signals need to be read alongside bottlenecks at individual facilities.
These three developments are not a chain of events with a single cause. The Korean item concerns vaccine supply; the two overseas items concern respiratory infection surveillance. They are presented together because they illustrate distinct questions about access to preventive resources, the course of infection, and the capacity to provide care. Once institutions distinguish the types of information, they can identify what else they need to ask locally. The questions for a vaccine supply coordinator need not be the same as those for an emergency department lead. Readiness begins, in part, with checking whether different teams are attaching different meanings to the same number.

Patients, visits and specimens are different units
Influenza-like illness refers to a symptom pattern that meets a surveillance definition; it does not mean that every person counted has laboratory-confirmed influenza. The World Health Organization (WHO) provides surveillance definitions for influenza-like illness and severe acute respiratory infection and explains their role in monitoring trends consistently.[4] Shared definitions help comparisons. They should not be turned into a threshold for deciding whether an individual needs medical attention. This column likewise does not recommend delaying care or choosing treatment on the basis of a particular temperature or symptom alone. Surveillance reporting and clinical assessment have different purposes and responsibilities. Respecting that distinction is part of using the numbers correctly.
In the US system, clinical laboratory results, outpatient visits for influenza-like illness, and emergency department discharge diagnoses are collected through different channels. CDC's methods explicitly explain that the outpatient influenza-like illness measure does not count laboratory-confirmed influenza alone.[5] It is useful to examine whether several indicators rise together, but their numerators cannot simply be added to produce a patient total. One person may attend an outpatient clinic and later an emergency department; more than one specimen may also be collected during a visit. Without person-level linkage in a published aggregate table, these potential overlaps cannot be removed precisely.
The denominator is essential to understanding a proportion. When test positivity uses tested specimens as its denominator, it describes the positive share of that tested sample. It does not describe the proportion of all local residents who are infected. Changing whom an institution tests can change positivity even if infection conditions remain the same. Consider a hypothetical institution that previously tested mainly people with clear symptoms and then extends testing to other inpatients. This is an illustrative example, not an actual reported event. If the additional group has a lower positive share, overall positivity may fall. That change alone does not show that risk has declined among the original symptomatic group.
Operational questions may require different denominators. An emergency department lead needs both the proportion of visits involving respiratory symptoms and the absolute number of those visits. A laboratory lead needs the number of specimens actually received and the number with delayed results. A bed manager needs the number of patients whose admission has been decided but who have not yet moved, together with their waiting times. Combining these into a single ratio may look convenient while obscuring where delays occur. A better approach is to display them over the same dates and time intervals while retaining their units. Selecting measures around the problem to be reduced makes it possible to assess whether a better indicator reflects better care processes.
Two proportions from a public source table
This analysis uses the weekly clinical laboratory table in CDC's week 44 report. It lists 52,287 tested specimens and 5,911 influenza-positive specimens, comprising 5,864 influenza A and 47 influenza B results.[2] The figures are preliminary and may change as additional reports arrive. The unit of observation is a specimen, not a unique person. These are weekly reports from a surveillance network, not a random sample of the entire US population. We have not inferred individual characteristics or repeat-testing patterns that the table does not supply. People not tested, testing outside the reporting network, and the extent of late reporting cannot be quantified from this table alone and remain unmeasured here.
Calculations were restricted to descriptive statistics using the published integers. We first checked that the influenza A and B counts added to the positive total. We then subtracted positives from all tested specimens and specified each proportion's denominator. Positivity is 5,911 divided by 52,287, multiplied by 100; the influenza A share among positives is 5,864 divided by 5,911. Calculations used unrounded values, with percentages rounded to one decimal place only for display. We did not pool other weeks or countries, or invent weights and adjustments that would require individual-level data.
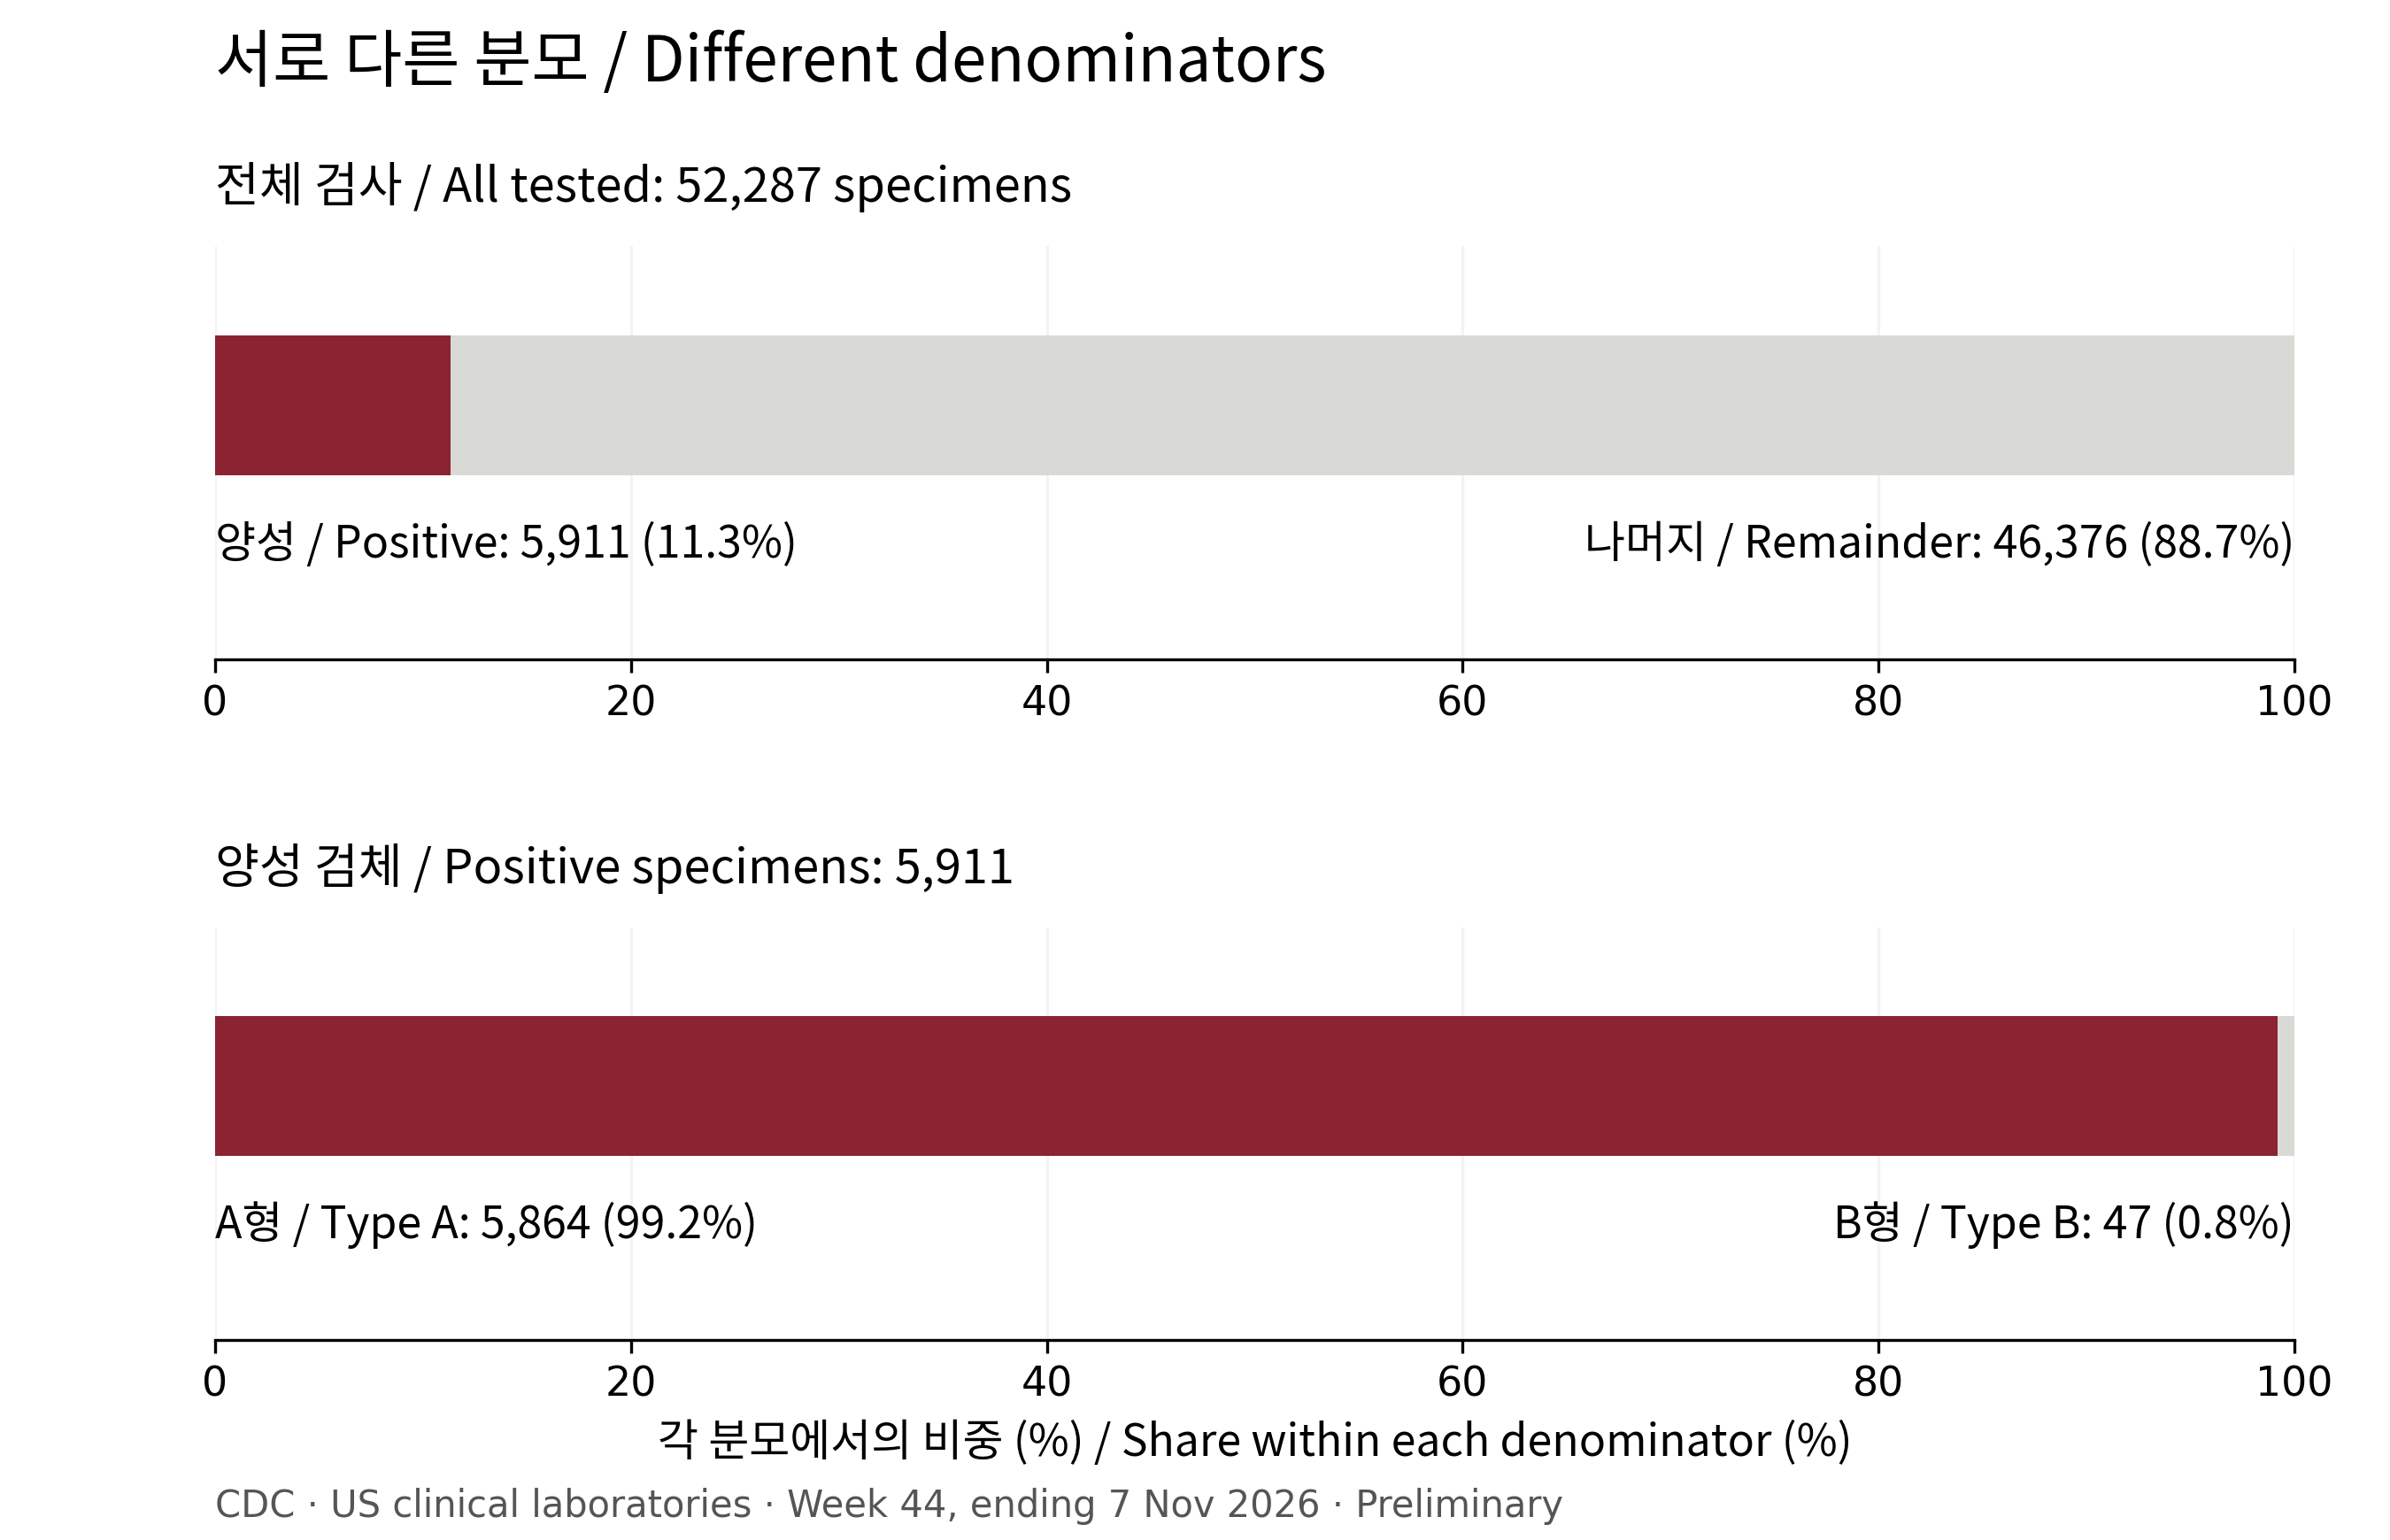
In the first bar of Figure 1, positive specimens make up 11.3% of all tested specimens, and the remainder 88.7%. In the second bar, influenza A accounts for 99.2% of positive specimens and influenza B for 0.8%. The bars use the same percentage scale but different denominators: all 52,287 specimens in the first and the 5,911 positives within them in the second. The very large influenza A share does not mean that most tests were positive. Nor do the remaining 46,376 specimens represent confirmed infections with other pathogens. They are simply the calculated remainder outside the reported influenza-positive total.
| Category | Specimens | Denominator (specimens) | Share (%) |
|---|---|---|---|
| Positive | 5911 | 52287 | 11.3 |
| Remainder (calculated) | 46376 | 52287 | 88.7 |
| Type A among positives | 5864 | 5911 | 99.2 |
| Type B among positives | 47 | 5911 | 0.8 |
The figure is intended to show how changing the denominator changes the question, rather than to predict epidemic size. The two percentages cannot be compared as a multiple of risk, and the influenza A share cannot establish disease severity or vaccine effectiveness. Even within one table, one measure describes the distribution of test results and the other the type distribution within positive results. For staff education, it may be more useful to ask what constitutes the whole before showing the bar lengths. Being able to explain the denominator also helps explain which decisions a value cannot support.
Information needed before more elaborate statistics
Confidence intervals and significance tests were not added because the information needed to interpret them is missing, not because the calculations are difficult. We do not know whether specimens are independent, how frequently individuals were tested repeatedly, or exactly how people were selected for testing. A simple binomial model would produce an interval, but what uncertainty would it actually represent? Estimating sampling error would not resolve selection bias. The defensible conclusion from these data concerns the composition of reported specimens. Estimating infection risk among local residents would require a sampling design and population information suited to that purpose.
Week-to-week comparisons also require more than a numerator. In a hypothetical example, if positive counts rise while testing expands substantially, increased detection may partly reflect that expansion. Conversely, positivity could rise while detected positive counts fall if testing capacity contracts because fewer staff are available. Neither situation can be judged to have improved from a single measure. An institution's weekly report can record dates when testing criteria changed, equipment was unavailable, or reporting participation changed. These annotations are not excuses for rising or falling numbers. They are information needed to judge whether the figures are comparable.
The absence of patient-level information in a public table also has implications for how local institutions design their own records. This is not an argument for sharing personal information widely. It is a proposal to consider whether, under appropriate access controls and protections, an institution can link testing, result acknowledgment and bed-transfer times for the same visit. External sharing can be limited to necessary aggregates. Before aggregation, however, teams need to decide how to handle duplicate specimen registrations within a visit. Combining numbers first and defining them later can leave departments reporting different counts under the same indicator name.
Missingness is itself a finding. Records with no result-acknowledgment time should not all be treated as promptly reviewed. If it is unclear whether a result was unreviewed, reviewed without documentation, or reviewed by another team, the status should remain unknown. Reporting the number and reasons for exclusions alongside an average allows readers to judge whether an apparently fast process partly reflects missing records. This can be done before adopting specialized statistical software. Rather than producing a confident-looking number from incomplete information, an institution can begin improvement work by identifying which parts of its process are not documented.
What the evidence on rapid testing supports
The FluPOC randomized trial compared a molecular point-of-care testing strategy with routine care in 613 adults admitted with acute respiratory illness to two UK hospitals. Among participants with influenza, 99 of 100 in the testing-strategy group received antivirals within five days of admission, compared with 63 of 102 controls. Use of isolation facilities improved, while clear reductions in length of stay and antibiotic use were not demonstrated.[6] This supports linking testing to care processes, not an assumption that all outcomes improve together. Its adult inpatient setting should not be applied unchanged to pediatric outpatient care or ambulance practice.
The open-label design and performance of testing by research staff matter when considering implementation.[6] In routine care, the person assigned to testing may also have other urgent duties. Our operational interpretation is that comparing instrument processing speeds alone is insufficient. Institutions should examine the wait for specimen collection, the queue for the instrument, the time until a result is reviewed, and the time until action follows. This does not imply that the paper measured delays in Korean hospitals. It identifies conditions to check before applying the findings in a different setting. Knowing which interval can be shortened also makes alternatives to investment easier to compare.
Randomization has strengths for evaluating an intervention, but conclusions still cannot extend beyond the outcomes examined. The trial is not a basis for declaring that rapid testing lowers mortality in every hospital. Improvements in useful process measures and improvements in final health outcomes require separate assessment. Conversely, failure to demonstrate a difference in every outcome does not erase the value of a process improvement. Practice needs to recognize both what improved and what remains uncertain. If earlier information is valuable for bed allocation or treatment decisions, institutions can separately verify whether that value is realized in their own work.
The next action matters as much as the result
CDC's healthcare influenza guidance sets out a combined approach involving vaccination, respiratory hygiene, management of ill staff, infection control precautions, and environmental and engineering measures.[7] The proposals here likewise do not treat testing as a solution to every problem. They focus on where patients wait before results are available, who observes changes in their condition, and who reassesses placement once a result arrives. Responsibilities must be assigned within each institution's clinical and infection prevention standards. Overseas guidance should serve as a framework for checking missing connections in work, rather than replacing an approved Korean institutional procedure.
The first process to examine is notification. The time a result appears on a screen may differ from the time the responsible person acknowledges it. Overnight arrangements should specify who receives notification and who takes over when responsibility changes. More alerts do not guarantee acknowledgment. An improvement plan should also investigate the burden of duplicate notifications. After naming a responsible person and a backup, teams should establish how to document handover. This allows unacknowledged results to be identified even when responsibility changes. This review does not presuppose the purchase of a particular product.
The second is the decision to move a patient. Even after a result is reviewed, the patient may remain in place if an appropriate bed is not ready. A report of faster testing and staff experience of unchanged length of stay can therefore both be true. It is useful to separate the interval from acknowledgment to placement decision from the interval between that decision and actual transfer. Vacating a bed, completing cleaning and assigning staff to receive a new patient involve different responsibilities. Rather than assuming one department caused the delay, teams should jointly establish when the necessary conditions were not yet in place.
The third is the handling of negative results. Failure to detect influenza should not be expanded into a statement that no respiratory infection is present. The point here concerns accurate operational language, not individual test interpretation or treatment instructions. Patient information and handover screens can identify what a test covered so that a single word, “negative,” does not appear to remove every precaution. Actual placement and further assessment remain decisions for the treating team under infection prevention procedures. Simplifying a record should not make clinically different situations appear equivalent.
Design waiting arrangements and ambulance handovers together
CDC's respiratory virus prevention guidance addresses reducing crowding in shared spaces, separating symptomatic patients while they wait, and providing information in suitable languages and accessible formats.[8] In applying this to Korea, the relevant question is what observation and assistance a waiting area can provide, not simply whether it has a separate name. Separating routes could have an unintended consequence if it delays recognition of a change in condition. Infection prevention and emergency care teams therefore need to review the arrangement together. The proposal is to specify not only which signs to install but also who will notice and respond when someone needs help.
Consider a hypothetical hospital planning to direct patients awaiting test results to an area away from its usual treatment space. This is not a description of actual SCH hospital operations or a current event. Before implementation, the hospital could check whether patients can hear calls, whether those with mobility limitations can obtain assistance, and whether staff can reach the area in an emergency. Having enough chairs would not, on its own, establish readiness. If the review exposes problems, the team can compare moving the waiting area with changing staff assignments.
Between 119 ambulance crews and receiving hospitals, information about suspected infection should be distinguished from information about capacity to provide care. Whether testing has been performed, results are pending, or a result has been confirmed should not be compressed into the same label of “confirmed infection.” Pre-transfer information should be determined within existing procedures according to the patient's condition and circumstances. This column does not propose delaying a necessary transfer to obtain a test result or choosing a hospital outside those procedures. It proposes reviewing whether handover wording accurately distinguishes pre-test and post-test states. Clear information enables the receiving team to prepare within what is actually known.
Assessing ambulance workload can extend beyond time to hospital arrival to include the process through patient handover and readiness for the vehicle's next assignment. Measurement first requires definitions of arrival, completed handover and completion of necessary turnaround tasks. If timestamps come from different systems, clock settings and entry practices also need checking. Before-and-after comparisons should consider changes in travel distance, patient condition and time of day. These checks help avoid attributing every time difference to respiratory infection or to the responsibility of a particular hospital.
For whom is the procedure harder to use?
Receiving the same notice does not guarantee equal access. People who have difficulty reading text or hearing announcements may need another way to receive information. Teams can also check whether waiting apart from a caregiver is feasible and whether results and next steps can be explained to someone who needs an interpreter. This is not a proposal derived from an estimate of infection rates in particular groups. It is an operational review of whether a new procedure creates additional barriers for people who already need assistance. Evaluating crowding measures through average waiting time alone may miss burdens concentrated among some patients.
Even in institutions serving many older people or people receiving care for multiple conditions, teams should not assume without checking that everyone needs the same assistance. A better approach is to identify actual support needs and record instances where moving between waiting areas or obtaining explanations makes access to care harder. This need not involve unnecessary collection of detailed personal information. Requests for mobility assistance and checks of understanding could, for example, be examined in anonymous aggregates. The focus should be on procedural problems the institution can address, rather than explanations that cast a population group as the cause of the problem.
Access to vaccination can be viewed in the same way. An official Korean account of programme-wide progress does not guarantee opening hours or stock at the facility an individual plans to visit. Institutions providing information can state when it was checked and where it can be checked again. A practical task is to ensure that advice matches actual operations, so that supply-related news does not prompt unnecessary visits to multiple locations. There is no need to speculate about or blame the behavior of a vulnerable group. Managing the scope and validity of the information provided is something institutions can do themselves.
Staff readiness also requires more than a total headcount. Teams need to establish which tasks require cover and whether newly assigned staff understand testing and handover procedures. A record of attendance at training is not the same as confirmation that someone can perform the required work. A short simulated scenario can test whether result notification continues through a change of responsibility. The purpose is not to test staff in order to assign blame, but to establish whether the procedure depends on one individual's experience. Operating during absences requires a sequence of work and handover conditions that others can understand.
Compare equipment purchases with alternatives on equal terms
Adding rapid testing instruments need not always be the first option considered. More frequent specimen transport, clearer overnight notification and resolution of pending placement decisions are also possible interventions. Their relative value depends on where delay currently occurs. If specimens wait for an instrument, expanding analytical capacity may matter; if communication breaks down after a result is available, improving notification may be the more appropriate first step. This judgment cannot be calculated by importing an overseas trial's effect size. It requires local time records and observation of the work itself.
Comparing only the price of one test also defines costs too narrowly. An operational plan should include staff time, quality control, supplies and a fallback route if equipment fails. Equally, improving an existing system should not be assumed to be free. Adding a notification role or changing transport intervals may affect other work. Alternatives need comparison over the same period and scope of activity to identify which costs actually increase or decrease. Because no local cost data were obtained for this analysis, it makes no claim that one approach is cheaper or more cost-effective.
Expanded testing also warrants a counterinterpretation. Producing more results sooner may create more placement decisions earlier, increasing a team's immediate workload. This is neither proof of failure nor an inevitable consequence. It is a possibility to examine during implementation. Measuring laboratory performance alone would not reveal whether work has shifted to another department. We therefore propose evaluating patient movement, staff time and use of waiting space together. Whether time saved in one department outweighs additional work in another must be established from actual data.
Start small, with an evaluation that can answer a question
A practical starting point is to select one delay in the existing process. For example, a team might focus on the interval during which a result is available but acknowledgment is undocumented. This is not a proposal for a universal target time. Each institution should review its baseline data and staffing conditions, choose an appropriate target, and record the basis for that choice. Defining the measure before implementation reduces the temptation to change it when results differ from expectations. If the evaluation period or population needs to change, the reason and effective date can be recorded alongside the change.
At a minimum, an evaluation table needs an observation unit, a start point, an end point and rules for missing data. Time distributions can be examined through the median and the pattern of prolonged cases as well as the mean. The median is the middle value when recorded times are ordered; it may not adequately convey a small number of very long delays. Reviewing prolonged cases separately can prevent an improvement in one summary measure from being mistaken for improvement throughout the process. Distinguishing time needed because of a patient's condition or care requirements from avoidable interruptions requires professional assessment by the responsible team.
Before-and-after comparisons are useful but are not equivalent to experiments that establish causation. Influenza activity, patient mix, staffing and testing criteria may all change over the same period. Where feasible, teams can examine comparable times of day and care pathways separately and record other changes during the comparison period. More elaborate analysis should be considered only when adequate data and design support it. For an early improvement project, describing where change was observed and what alternative explanations remain is more defensible than attaching a significance test to a small table to declare an effect. The findings can then guide decisions about expanding the evaluation.
Evaluation should also examine operational changes that may represent unintended harms. Did efforts to accelerate acknowledgment delay other care? Did a separate waiting area leave mobility assistance insufficient? These questions ask whether achieving one favorable measure came at the expense of another important process. If problems emerge, the intervention should be open to revision or a narrower scope. Maintaining the original plan indefinitely is not the definition of success. It is more important to name a responsible reviewer and a review point so that the work can be redesigned in response to observed results.
Questions to carry into the next surveillance report
What Korean institutions can take from overseas surveillance is a way of asking questions rather than a numerical alert threshold. They can first establish which people and specimens were included, the dates represented, and whether their own measures use comparable units. Local demand and current capacity then need assessment. Converting overseas figures into a domestic bed requirement would require additional information on the local population, pathways into care, severity, admission decisions and bed operations. A precise bed forecast without those inputs would be speculation presented in the form of a calculation.
The Korean supply statement and the US and England surveillance reports each offer useful information, but this analysis does not combine them into a single risk score. It calculates specimen composition from a public table and distinguishes processes improved in a randomized trial from outcomes not established by that trial. The proposal for Korean practice is to record the intervals between testing, notification, placement and transport, and evaluate where those connections fail. The question remains useful even if next week's figures change. Readiness becomes concrete when institutions move beyond an upward arrow in a report to check whether the necessary information reaches the next responsible person in time for action.
References
- [1] 질병관리청. [11.11.보도설명자료] 인플루엔자 국가예방접종은 정상 진행중이며, 민간시장 백신공급도 지원하고 있습니다. 2026-11-11.
- [2] CDC. Weekly US Influenza Surveillance Report: Key Updates for Week 44, ending November 7, 2026. Published November 13, 2026.
- [3] UK Health Security Agency. National flu and COVID-19 surveillance report: 12 November 2026 (week 46).
- [4] WHO. WHO surveillance case definitions for ILI and SARI.
- [5] CDC. U.S. Influenza Surveillance: Purpose and Methods.
- [6] Clark TW, Beard KR, Brendish NJ, et al. Clinical impact of a routine, molecular, point-of-care, test-and-treat strategy for influenza in adults admitted to hospital (FluPOC): a multicentre, open-label, randomised controlled trial. Lancet Respir Med. 2021;9(4):419–429. DOI: 10.1016/S2213-2600(20)30469-0. PMID: 33285143.
- [7] CDC. Infection Prevention and Control Strategies for Seasonal Influenza in Healthcare Settings. September 29, 2026.
- [8] CDC. Preventing Transmission of Viral Respiratory Pathogens in Healthcare Settings. May 21, 2025.
Recent Korean, US and England reports frame an analysis of test denominators, rapid-testing evidence, and practical ways for hospitals and ambulance services to evaluate their response.
SCH-COLUMN-2026-11-14,EN,FLU-DENOMINATORS