[EN] Turning food-insecurity projections into health action: DRC figures and continuity of care | 2026-11-15
관리자
SCH Disaster Medicine Center — Analysis
2026-11-15 · SCH-COLUMN-2026-11-15 · FOOD-CARE-CONTINUITY · EN
A published warning about a future that has not arrived
In disaster medicine, large numbers demand action, but they cannot by themselves tell a hospital how many beds to open. The number of people struggling to obtain food, the number needing a nutritional assessment, and the number requiring admission are different quantities. Making that distinction does not diminish the crisis. It is the starting point for deciding which assistance must reach whom, and through which route. On 15 November 2026, our focus is how to translate projections of food insecurity in the Democratic Republic of the Congo into health-service planning. The task is to prepare promptly without presenting future risks as harm already confirmed.
Our search did not identify a newly announced major domestic event dated 15 November. As a recent relevant measure, the Korea Disease Control and Prevention Agency announced on 6 November that Nigeria would become a priority quarantine management area from 9 November. The statement retained Korea’s overall Ebola risk assessment at “low.” This was a precaution responding to conditions overseas, not a report of a domestic case today.[1] For Korean healthcare facilities, the question is whether relevant travel information reaches clinicians from reception, rather than whether to raise the risk level independently. Stronger border precautions and a domestic outbreak are not equivalent.
Internationally, WHO published a report on two laboratory-confirmed cases of Middle East respiratory syndrome, or MERS, in Qatar on 13 November. The confirmation dates were 5 and 25 August, and Qatar notified WHO on 29 October. The report identified no secondary infections.[2] It therefore cannot be described as a new cluster arising in November. A report published after the events can still inform surveillance and communication in healthcare facilities. Substituting its publication date for the event dates, however, can create a false impression of a sudden increase in risk. There is also no basis for connecting these cases to the crisis in the DRC as one transmission chain.
The central development is the warning about food insecurity in the DRC issued jointly by FAO, WFP, UNICEF and WHO on 13 November. The agencies called for food assistance and essential health services to be sustained together amid conflict, displacement and disease outbreaks.[3] This is not a casualty count for a disaster that occurred on a single day. It assesses living conditions over a period and projects further deterioration. Korea’s quarantine measure, Qatar’s case report and the DRC’s overlapping emergencies are distinct developments. Keeping those differences intact, this column concentrates on the food and healthcare access problems that require sustained preparation.
Data and methods: what was counted?
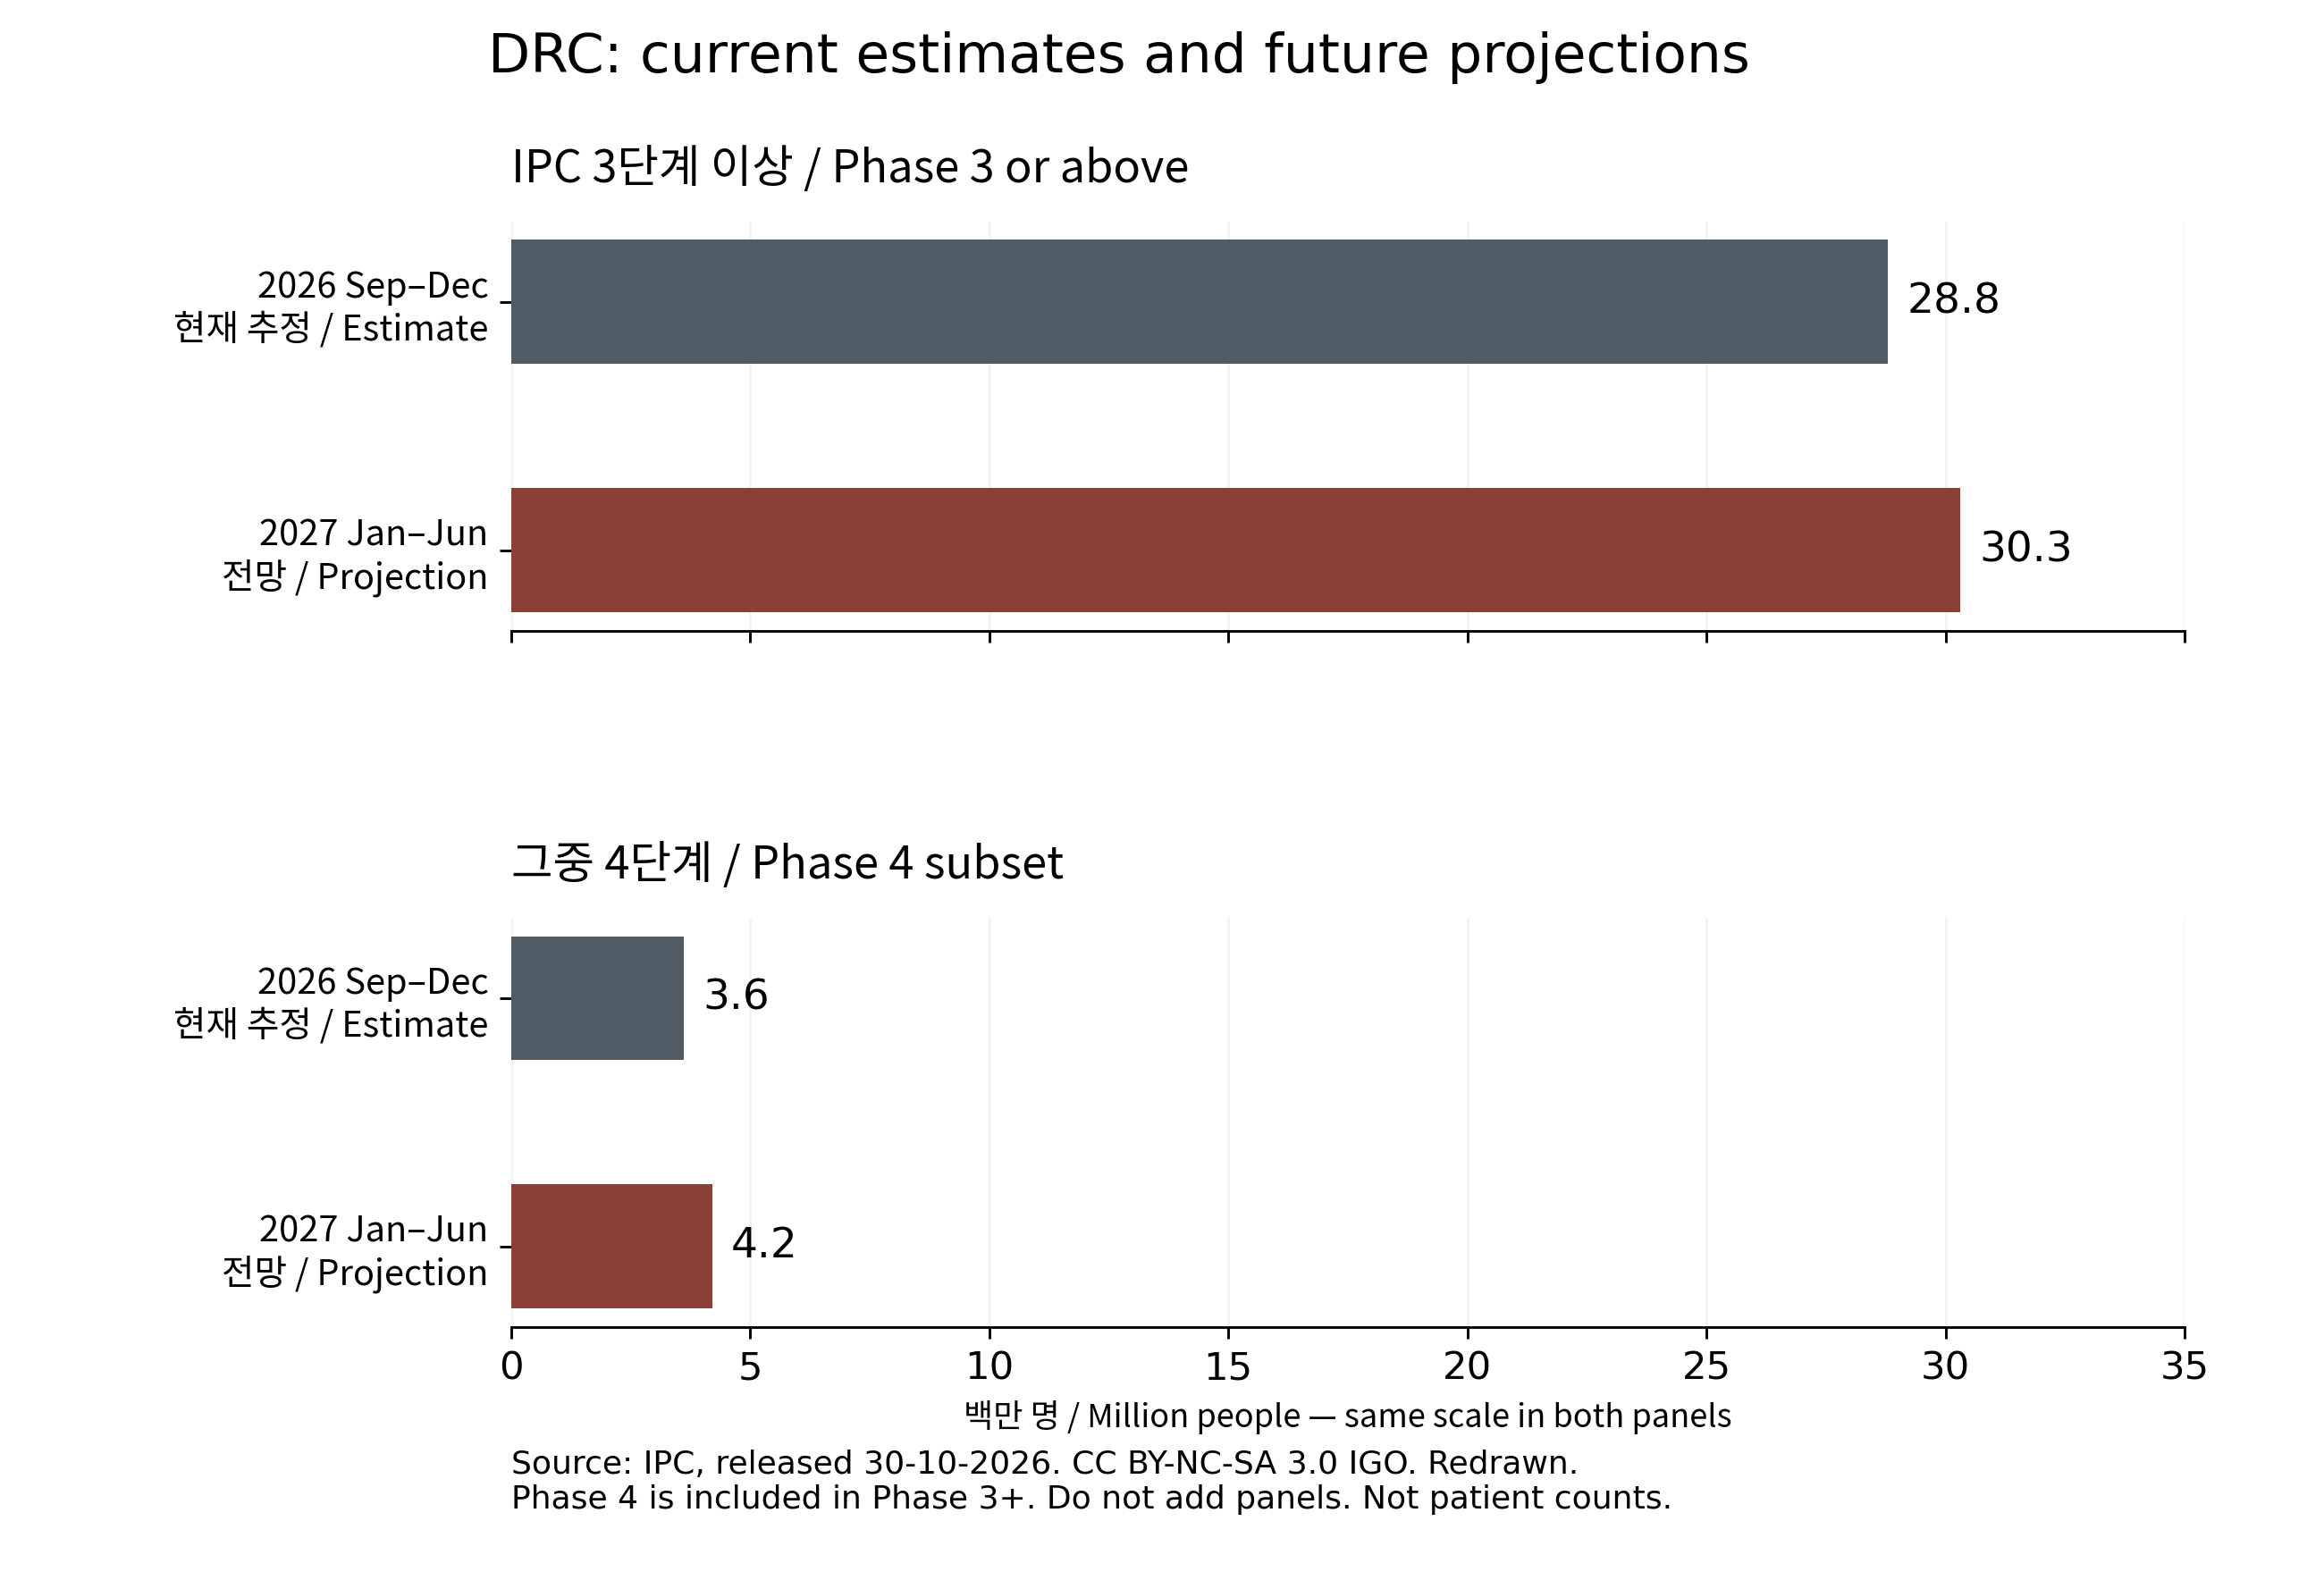
The public aggregates used here come from the Integrated Food Security Phase Classification, or IPC, analysis released on 30 October. For September–December 2026, it estimates 28.8 million people in the DRC in acute food insecurity Phase 3 or above, including 3.6 million in Phase 4. The January–June 2027 projection gives 30.3 million and 4.2 million, respectively.[4] IPC labels Phase 3 “Crisis” and Phase 4 “Emergency.” These classify food access and living conditions; they are not clinical grades of patient severity. The first period is a current-situation estimate; the second is a future projection. These are national population aggregates for specified periods, not clinical records or a daily patient register. That distinction determines the scope of analysis. The figures cannot be relabelled as today’s infections or admissions for malnutrition.
We transcribed the four published values and calculated differences between periods and relative changes from the earlier values. The figure places the Phase 3-or-above total and its Phase 4 subset in separate panels. Stacking those two quantities would count some people twice, so we did not do so. The observational unit is a population aggregate by period and phase category; the unit of measurement is millions of people. We did not calculate population prevalence. The public summary does not provide individual follow-up data, the exact sampling structure or uncertainty intervals for these estimates. Missing individual data were not treated as people with no needs or no illness.
IPC results are available under CC BY-NC-SA 3.0 IGO, requiring attribution, noncommercial use and sharing under the same terms.[5] The redrawn figure and transcribed table carry those terms. They present official results in another format; they are not findings from a new field survey. The joint announcement and the IPC source are consistent in direction, but the announcement cites the same analysis and is not an independent second survey. Confidence in a number depends more on understanding its definition and derivation than on how often it has been republished.
Results: more people and potentially harder delivery
Using the transcribed figures, the difference for Phase 3 or above is 1.5 million people, approximately 5.2% of the earlier estimate. For Phase 4, it is 0.6 million, approximately 16.7%. These percentages describe the gap between a current estimate and a future projection, not a future increase already observed. The comparison raises a question beyond the total volume of assistance. Relatively faster projected growth among people facing more severe living conditions also invites a review of delivery arrangements. Procuring more supplies will not meet a household’s needs if those supplies never reach it. National aggregates cannot identify which households have poor access. Local delivery conditions and changes in clinical severity require separate evidence.
We can also calculate the Phase 4 share within the Phase 3-or-above population. It is 3.6 divided by 28.8, or 12.5%, for the earlier period, and 4.2 divided by 30.3, or approximately 13.9%, for the later period. The difference is about 1.4 percentage points. The denominator is the Phase 3-or-above population in each period, not the entire population of the DRC. A larger share does not establish a corresponding increase in an individual’s probability of moving to a higher phase. Individuals were not followed through these aggregate figures, and migration or changes in the included population cannot be separated. Composition describes a distribution of needs, not personal prognosis.
The source presents millions to one decimal place. Additional digits from a calculator cannot make those inputs more precise. If conventional rounding is assumed, allowing a difference of 50,000 people around each value gives approximate relative-change ranges of 4.9–5.6% for Phase 3 or above and 13.7–19.7% for Phase 4. This is an illustrative sensitivity analysis for rounding, not a statistical confidence interval. It does not incorporate survey error or uncertainty in the projection. The direction warrants discussion, but the decimal in 16.7% should not become a falsely precise policy threshold.
| Period and status | Phase 3+ (million) | Phase 4 subset (million) | Phase 4 share (%) |
|---|---|---|---|
| 2026.09–12 · Current estimate | 28.8 | 3.6 | 12.5 |
| 2027.01–06 · Projection | 30.3 | 4.2 | 13.9 |
The periods also differ in length: the current-situation estimate covers four months and the projection six. Dividing each population by its number of months would not produce monthly incident cases. A population classified as experiencing a condition during a period is a different concept from the number of new patients each month. Nor can the two values be added to produce a cumulative affected population. Such elementary errors can emerge as a report passes into hospital planning. Periods and units should stay beside the figures in meeting papers, so their meaning survives when a table is excerpted.
What the medical evidence supports
There is evidence for considering nutritional status and infection together. Rytter and colleagues’ 2014 systematic review reported several immune-function changes associated with childhood malnutrition, while emphasizing predominantly observational designs and difficulty separating the effects of infection itself.[6] This supports treating food insecurity as relevant to health. It does not supply a multiplier for predicting infections or deaths from the current DRC totals. The assumption that everyone included in a food-insecurity category has the same clinical nutritional status would already be invalid.
WHO’s 2023 guideline on childhood acute malnutrition addresses nutritional assessment at initial triage, decisions between inpatient and outpatient care according to clinical status, and continuity of care. Recommendation B2 on referral and admission is conditional and based on low-certainty evidence; B4 on continuity is a good practice statement.[7] Having a guideline is not the same as having strong evidence for every operational arrangement. This column does not transfer that childhood guidance directly to adults or to all Korean evacuation shelters. Individual treatment decisions and organizational design are also distinct tasks.
The central proposal here is to prevent needs identified outside a hospital from being lost at its entrance. This does not mean classifying every household receiving food assistance as patients. It means that, when someone needing medical assessment is identified during food support, handing over a telephone number should not necessarily be the end of the referral. Food-support organizations should not replace diagnosis, and hospitals should not assume responsibility for every logistical or livelihood need. Clear roles and confirmation that the next organization has accepted a handover can reduce gaps while preserving each organization’s expertise.
Turning projections into preparation
WHO’s disaster risk management framework emphasizes planning informed by risk and capacity assessments, coordination across sectors, and continuity of essential functions.[8] Our proposed application distinguishes two kinds of decisions. One involves preparations that can begin early: checking contacts, suppliers and obstacles along delivery routes. The other involves choices, such as converting wards or substantially reallocating staff, that also affect other patients. A projection may be sufficient to begin much of the former work. The latter requires additional information about local clinical demand and usable capacity. The same warning need not imply the same evidentiary threshold for every decision.
For example, when the population needing assistance is expected to grow, field coordinators can first establish which facilities are actually open. Does a mapped facility receive patients? Is a responsible staff member reachable? Is transport operating? These checks do not demonstrate clinical effectiveness, but they can reveal specific preparedness gaps. Simply counting facilities can conceal shorter operating hours or a discontinued service within a building that remains open. Recording available services and the date they were verified, alongside the institution’s name, makes the information more useful for action.
Preparations can then be ordered according to whether they remain useful if the projection proves wrong. Correcting contact details, checking supply expiry dates and removing duplicate handover fields do not depend for their value on a crisis reaching a particular size. Conversely, a large purchase based on incorrect demand assumptions can leave storage and transport burdens. Before committing substantial funds, planners should check replenishment lead times, whether existing stock is usable, and what can be shared with other organizations. Active preparation does not require finalizing every decision at once.
Where the route between field services and hospitals breaks
For hospital operations, the first question is where referrals stop. Someone advised to seek assessment but unable to obtain transport, someone who arrives without their referral information, and someone unable to return after a consultation face different problems. Grouping all of them as “non-attendance” produces equally vague solutions. Hospitals and support organizations could test recording four stages: referral initiation, receipt confirmation, attendance and the next plan. Personal information should be limited to what the work requires, and public analysis should use aggregates that do not identify individuals.
Emergency medical services—the system providing assessment and transport before hospital arrival—need a similar distinction. A request for food support is not automatically a request for emergency transport. Concentrating less urgent transport needs on ambulances can reduce availability for other emergencies. Equally, concern about infection or an uncertain address should not delay a needed assessment. Local plans should connect transport based on clinical urgency with ordinary mobility support, while identifying the responsible organizations and contact routes for each. This is a proposal for making existing decisions operational, not for introducing a new clinical triage rule.
When infection-related services and nutritional support are offered together, an arrangement intended to improve access should be checked for whether it gathers people in one place for too long. Combining counselling and distribution in one queue may reduce journeys but lengthen waits. Excessively separating locations may require caregivers to travel repeatedly. A single national aggregate cannot decide which arrangement is better. Teams should first examine waiting times, busy periods and the experience of people with mobility difficulties, then assess whether adjusting hours or routes through the service makes a difference.
Discharge from hospital and the end of support should likewise be treated as different decisions. No longer needing inpatient care and being able to continue care at home are not necessarily the same condition. Hospitals can make clinical decisions while local support organizations assess residence, transport, and access to food and care. Sharing necessary information with appropriate consent can prevent people from having to repeat the same circumstances to several departments. An assessment confined to completed discharge paperwork may miss the living conditions that become relevant the following day.
Vulnerability should not become a fixed label
The term “vulnerable groups” can help explain priorities, but it can also make changing circumstances appear to be permanent personal characteristics. A household with young children may have reliable care and transport; an adult previously living independently may suddenly need help after losing mobility or income. Support should therefore not end with age or disability categories on a list. It should ask whether the person can currently use the services they need. This is not a new epidemiological claim about which group is at greatest risk. It is an operational question intended to keep existing records from concealing changes in daily life.
Access to information is also a condition of receiving support. If telephone or online booking is the only route, needs among people without usable devices or communications may appear less often in the records. A recorded decline in demand could then be mistaken for a real decline in need. Teams could consider complementary routes such as in-person information or assistance making contact, and record the route through which requests arrive. If requests increase after introducing a new route, worsening conditions must be distinguished from improved detection. Changes in numbers need to be read alongside changes in service design.
Feedback should go beyond a simple satisfaction survey. Asking only whether a service was convenient may not explain why someone abandoned the next visit. Questions about transport costs, gaps in caregiving, language and waiting conditions can identify circumstances that changed an actual decision. People who do not respond leave no account in the survey, so response rates and failed contacts should also be recorded. Few complaints do not establish good access. Particular attention is needed to whether people can speak freely when they fear losing support.
What Korea can transfer—and what it must reassess
There is no basis for inserting the DRC’s national figures into estimates of demand at Korean healthcare facilities. Conflict, population movement, markets and transport differ, as does the structure of available health services. What can be transferred is a sequence of questions rather than a population percentage: who needs food support after a disaster, how are people needing medical assessment identified within that population, and does assessment actually take place? That sequence must be designed around existing local emergency, health and welfare services. The urgency of an overseas crisis cannot substitute for validating a Korean plan.
The following is a hypothetical example, not an actual event. Suppose prolonged road disruption requires meal support for both shelter residents and households remaining at home. Relief staff report completed deliveries, a public health centre reports outreach consultations, and a hospital reports patients seen. All three numbers could rise without revealing repeated counting of the same households or persistent exclusion of harder-to-reach households. Rather than adding departmental activity into one total, a common handover process—with consent and privacy safeguards—to establish whether services connect could reveal the problem more accurately.
In this hypothetical locality, the hospital could begin by assigning someone to connect existing clinical care with community support at reception, instead of immediately opening a separate ward. That person’s role would be to identify missed referrals and contact the next organization, not direct individual treatment. The 119 service would provide emergency assessment and transport while confirming where to refer non-emergency living-support requests; the local authority would identify transport that is actually available. Writing down these roles is insufficient. The plan also needs to specify who reconnects the person if the receiving organization is closed, reducing an unassigned responsibility at the final step.
Korean support services should also distinguish a delivery record from the recipient’s ability to use the food. They could check whether storage and preparation are possible and whether the arrangement conflicts with an existing care plan. These checks should not expand into a requirement that every field worker perform a clinical nutritional assessment. The first priority is a route for conveying observed difficulties to an appropriate professional. A realistic starting point is a system that recognizes and refers problems requiring judgment, rather than expecting everyone to judge every problem.
Hospital preparedness can also examine staff meals, transport and the ability to change shifts as conditions for maintaining services. Sufficient patient supplies cannot deliver planned care if the responsible staff cannot reach work. Conversely, adequate staffing cannot remove constraints caused by interrupted cleaning or food services. Bed counts should therefore be considered alongside available staff, essential support functions and logistics. There is no need to compress every element into one score. The department responsible for a problem needs an account of which function is limited and why in order to develop a remedy.
Alternative interpretations and the cost of choices
Connecting food-insecurity warnings with healthcare preparations invites a reasonable objection: spending scarce resources on hospital readiness could reduce immediate food assistance. That is a legitimate allocation question, not something to dismiss by asserting that medical preparation always comes first. Transport funding or food supply may be more urgent than additional equipment. The purpose of the proposed connection is not to draw every budget into hospitals. It is to establish jointly which interrupted service is leaving needs unmet. If the actual obstacle lies outside the hospital, the remedy belongs there too.
Another objection is that projections may be wrong, so services should respond only to demonstrated demand. Overreacting to uncertain forecasts can waste resources. Waiting for deterioration before making any preparations, however, can sacrifice the time needed for procurement and staffing. The central decision is therefore not to settle in advance whether the forecast is true or false. It is to compare losses that are difficult to reverse after waiting with the cost of preparing early. Giving each preparatory measure a duration and review date can also prevent a response from continuing indefinitely after its original justification has weakened.
Alternative interpretations of the data must remain open. Differences between the projection and current estimate reflect potential deterioration, but the public summary cannot separate contributions from coverage, population movement or changing assumptions. A rising national total does not mean every locality is moving in the same direction. National data can indicate where attention is needed; local deployment requires finer information. Automatically preferring the report with the larger number, or selecting values from different periods to favour a particular conclusion, would be poor practice.
Nor is there a single best form of assistance. In-kind provision, cash, transport support and additional healthcare services address different problems. Choices depend on whether needed goods are available in markets, whether travel routes are open and whether recipients can safely use the assistance. The aggregate data in this column cannot establish which approach is more effective. Organizations should record the reasons and conditions behind a choice and retain the ability to change it when conditions change. A chosen form of support should not itself be treated as evidence of success.
What would demonstrate improvement?
The first proposed process measure is the proportion of referrals that result in an assessment. Its numerator is people with a confirmed assessment among those referred for medical evaluation during a defined period. The referral definition, handling of duplicate referrals and observation period must be specified first. People not yet reached should be separated from confirmed failures. Rates with different observation periods should not be directly compared across institutions. This measure can indicate whether the handover process functions; it cannot establish whether health improved after assessment.
The second measure is handover time. Recording referral initiation, acknowledgment by the receiving organization and actual assessment separately can distinguish communication delays from travel delays. A mean alone may conceal a small group waiting much longer, so we suggest examining the median and distribution of prolonged delays as well. A long delay should not automatically be attributed to an individual worker. Operating hours, transport, the patient’s choices and missing information are possible explanations to investigate. The purpose is to identify and repair recurring obstacles, not to create a league table.
The third measure concerns people whose support was interrupted and why. Failed contact, unavailable transport, refusal of assistance, relocation and service use elsewhere represent different paths within the same apparent outcome. Counting someone who received appropriate assistance elsewhere as a failure would distort performance. Treating everyone without a record as successfully served would conceal gaps. Known and unknown outcomes should be reported separately. If unknown outcomes are common, follow-up methods need improvement before effectiveness can be judged.
Comparisons of performance require an adequate account of the periods before and after a new procedure. If requests increased, case severity changed and roads reopened while the handover procedure was also revised, later improvement cannot confidently be attributed to that procedure alone. Where feasible, comparable areas or repeated observations may help. Where comparability is inadequate, reporting descriptive change is more appropriate. This column does not calculate statistical significance from two pairs of aggregates. In evaluating field improvements, explaining who was missed and the conditions under which gains persisted comes before an impressive-looking p value.
Test a manageable change and preserve the basis for the next decision
One immediate option is to select a small number of existing referrals and trace their routes. Did sender and receiver understand the same information? Was the next action specified after contact failed? Could the person travel? This is exploratory process review, not a statistically representative survey. Its findings should not be published as a failure rate for the whole area. Turning them into specific corrections to a form or a contact route can nevertheless make a small review directly useful for the next response.
The revised procedure should also be checked for additional workload. More detailed records can enrich information while reducing staff time and increasing waits. Initially retaining only fields that determine the next action, and removing information nobody uses, may be preferable. Evaluation should ask what the receiving organization did with the information, rather than only whether the sender completed a form. More documentation is not evidence of a better response. The proposal depends on checking whether the time spent recording information actually improves connections.
During recovery, the route back to routine services deserves attention before choosing the date on which emergency assistance ends. Some people will still need follow-up care or support after temporary provision stops. When responsibility changes, teams can check whether contacts and appointments were passed on, whether the person understood the change, and whether the new organization is actually providing the service. Evaluating emergency operations solely by distribution volume leaves later gaps invisible. The next stage needs to work both when assistance begins and when it ends.
The most concrete task that today’s DRC data offer Korean healthcare organizations is not converting an overseas population count into domestic beds. It is reviewing the information used when help is requested, who connects a person to the next organization, and how completion of that connection is established. A projection is not a confirmed list of casualties, but it identifies time available for preparation. Using that time to test contacts, supply routes, assessment and follow-up can turn a warning from a large number into a response plan that can actually be examined and revised.
References
- [1] 질병관리청. 나이지리아 에볼라 해외유입 확인, 국내 유입 대비 검역망 넓힌다. 2026-11-06.
- [2] WHO. Middle East respiratory syndrome (MERS) – Qatar. Disease Outbreak News, 2026-11-13.
- [3] FAO, WFP, UNICEF, WHO. Conflict and disease outbreaks deepen DR Congo’s hunger crisis as record numbers are projected to face acute food insecurity. 2026-11-13.
- [4] IPC. Democratic Republic of the Congo: Acute Food Insecurity Situation for September–December 2026 and Projection for January–June 2027. Released 2026-10-30.
- [5] IPC. Privacy Policy, Content Sharing and Data Licensing.
- [6] Rytter MJH, Kolte L, Briend A, Friis H, Christensen VB. The Immune System in Children with Malnutrition—A Systematic Review. PLoS ONE. 2014;9(8):e105017. DOI:10.1371/journal.pone.0105017; PMID:25153531.
- [7] WHO. WHO guideline on the prevention and management of wasting and nutritional oedema (acute malnutrition) in infants and children under 5 years. 2023. ISBN 9789240082830. B1–B4.
- [8] WHO. Health Emergency and Disaster Risk Management Framework. 2019. ISBN 9789241516181. Section 5.2.
DRC food-insecurity projections and recent health developments frame an analysis of population needs, clinical demand, and measurable handovers between hospitals, emergency services and community support.
SCH-COLUMN-2026-11-15,EN,FOOD-CARE-CONTINUITY